Demand forecast quality is all too often determined by the "forecastability" of demand for individual products, customers, markets, etc. Although machine learning techniques are increasingly outperforming classical forecasting methods, there is no silver bullet to guarantee forecast quality (mostly accuracy).
What is needed is a systematic process to optimize demand forecasting in a targeted manner. The hypothesis is that forecasting is a waste of time until proven otherwise. Forecasting ties up considerable resources. If these activities do not generate any added value and may even cause planning errors, why forecast at all?
The goal is to make transparent which demand forecasting activities create value and which destroy value. And this granularly for each product, each market segment, each customer, etc.
The first step qualified baseline: a very simple forecast that is easy to generate. The idea behind it is: "What if we didn't forecast at all?" For example, the naive forecast is suitable as a baseline. Here, the demand for period t is equal to the demand for period t-1: de facto no forecasting. In practice, a moving average is also often used. Here, the demand for period t is equal to the average demand of n previous periods.
This baseline is surprisingly difficult to beat in practice. Studies suggest that 30 - 50% of the forecasts perform worse than the baseline. The question is therefore, for which demand forecasts, which products, which customers, which markets, etc. do we deploy our resources?
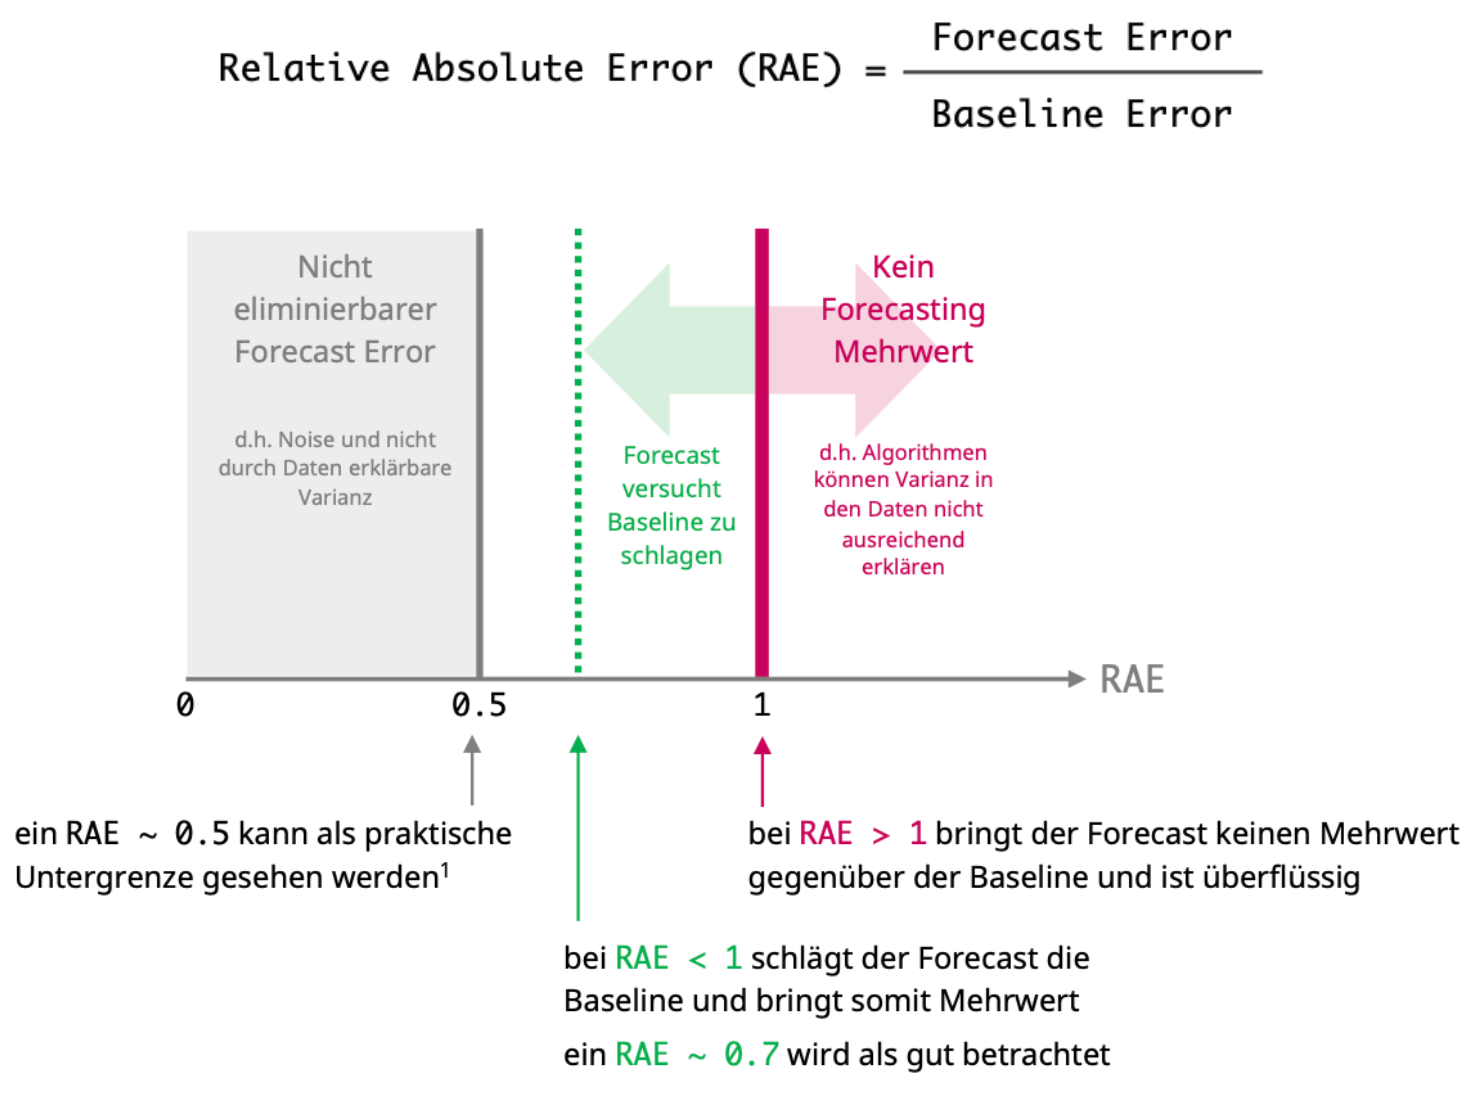
Against the baseline, forecasts are benchmarked that have been generated using more advanced methods such as machine learning or by experts. The benchmark is quantified via the Relative Absolute Error (RAE), i.e., the forecast error vs. the baseline error.
For example, if the RAE for the demand forecast for article A in country DE is 1, the forecast does not beat the baseline. If no RAE improvement is achieved even after optimization, the baseline is used for planning.
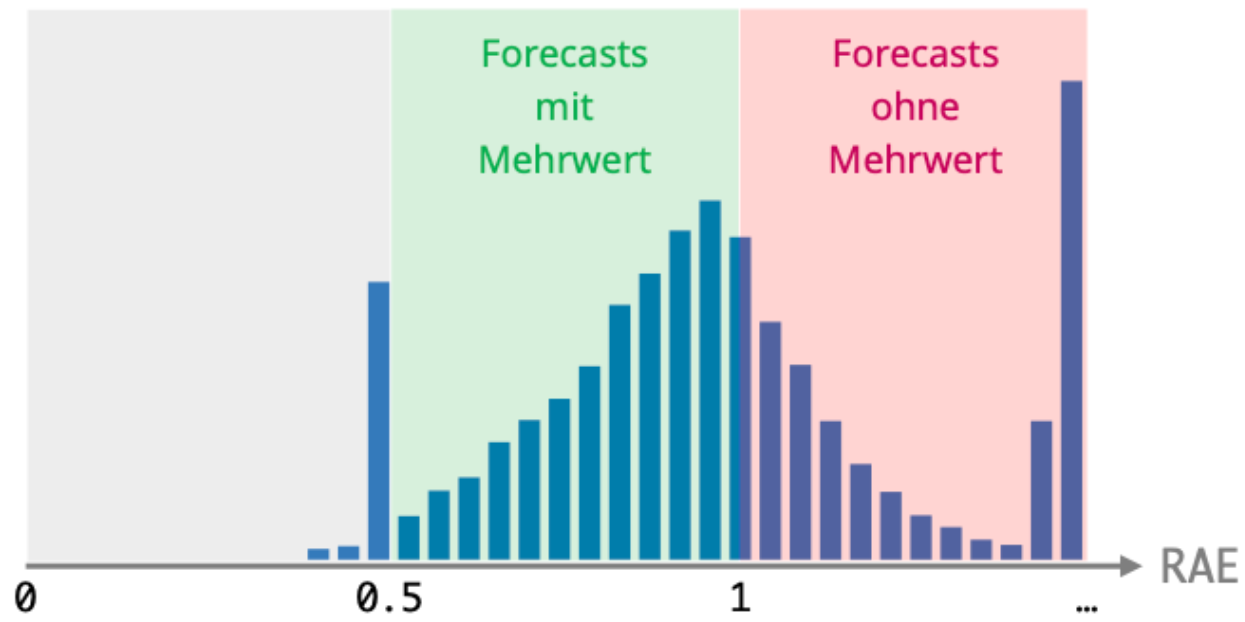
Typically, the RAE distribution looks something like this: Each bar represents the RAE of the Demand Forecast for a particular product, customer, market, etc.

Let's talk without obligation about how you can Planning reliability and Profitability can optimize through forecasting.
Current information on Best Practices in Forecasting and planning. The Flowtap Newsletter ensures you the decisive competitive advantage.